EyeQ Hospitals | Dashboards

Internal Softwares

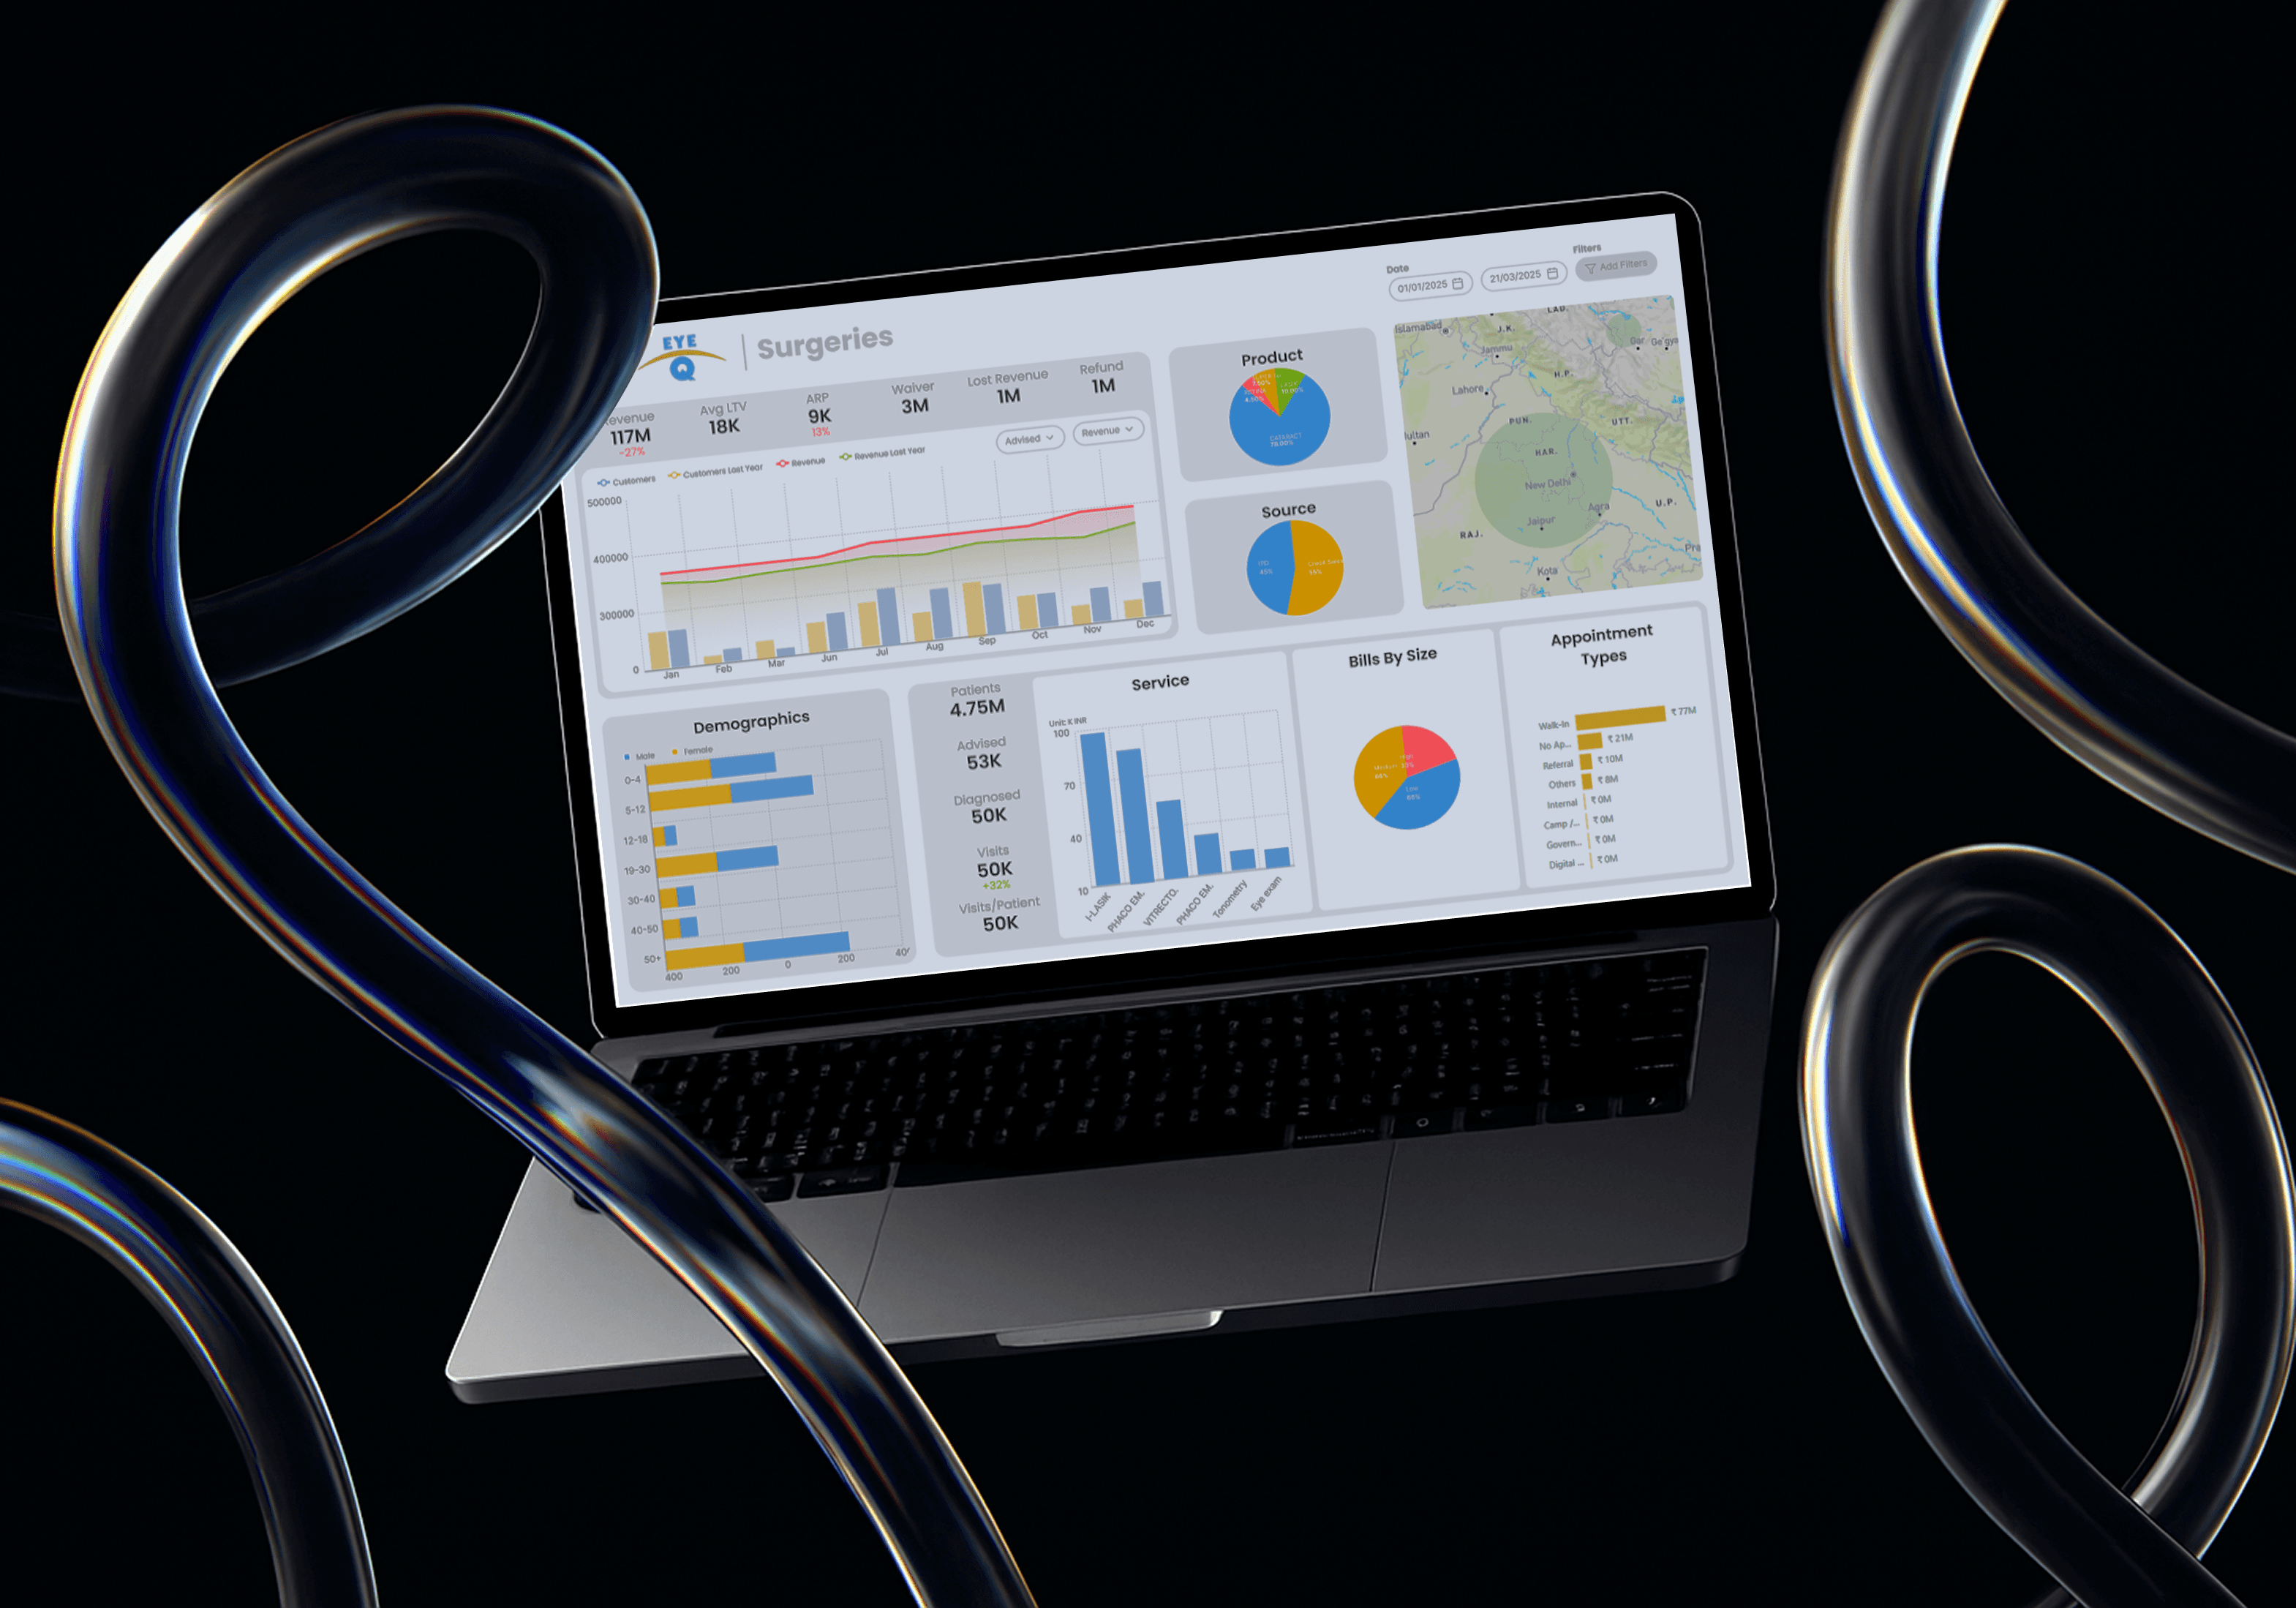
We built a comprehensive business intelligence platform using PowerBI to help Eye-Q’s operations team extract actionable insights from complex datasets through drill-through dashboards, threshold alerts, and scheduled reporting.

Jul 8, 2025

8 weeks

Data Modeling, PowerBI, Report Automation

Problem Statement

Eye-Q was collecting valuable operational and clinical data across multiple departments, but lacked a scalable tool to extract timely insights from it. Their legacy reporting system struggled with reliability and visual clarity, and teams had limited visibility into service-level metrics. Without automation and real-time analytics, data remained underutilized in critical decision-making.

Approach

We designed a PowerBI solution layered on optimized data models to streamline visualization across revenue, patient behavior, and service performance. Custom dashboards were built with drill-throughs, alerts, and time-based triggers. Each component was scoped for reliability, scalability, and low cognitive load. The system was integrated with scheduled email workflows to ensure timely reviews.

Solution Overview

Solution Overview

We delivered a modular PowerBI dashboard for Eye-Q’s operations team, enabling data exploration across services, geography, payment methods, and performance metrics. It included automated email alerts and trigger workflows tied to business thresholds.

Solution Overview

We delivered a modular PowerBI dashboard for Eye-Q’s operations team, enabling data exploration across services, geography, payment methods, and performance metrics. It included automated email alerts and trigger workflows tied to business thresholds.

360° Revenue Intelligence

360° Revenue Intelligence

We developed a centralized dashboard offering a consolidated view of all revenue streams—OPD, IPD, Labs, Optical, and Special Procedures. Key metrics such as performance vs. target, cluster-level breakdowns, and payment-type splits allowed leadership to assess revenue health and regional contributions in one glance, eliminating manual report compilation.

Cluster Leaderboards & Targets

Cluster Leaderboards & Targets

We introduced automated performance leaderboards at the cluster level with drill-through capability. These dashboards benchmarked locations against targets in revenue, patient count, and ARPP, enabling real-time performance tracking and spotlighting high-impact regions. This empowered faster interventions and sharper decision-making at the operational level.

Granular Demographic Insights

Granular Demographic Insights

Across OPD, IPD, and Special Procedures, we delivered demographic segmentation of revenue by age, gender, referral source, and bill size. This allowed teams to uncover underserved groups, optimize marketing spend, and tailor service offerings based on actual patient behavior. The result was better alignment between data insights and field operations.

Integrated Transaction Audit Layer

Integrated Transaction Audit Layer

We built a dedicated transaction-level view that enabled real-time audit of billing, payment method, dues by patient and company, and service fulfillment. Admins could filter by service type and track bill completion trends. This transparency layer significantly reduced back-and-forth over missed records and gave finance teams actionable, exportable reports.

Impact

The dashboard transformed Eye-Q’s fragmented reporting into a centralized, real-time decision support tool. Leadership now accesses service-level revenue insights, demographic breakdowns, and operational KPIs from a single platform—reducing dependency on manual reports and unlocking timely interventions at both regional and national levels.

12 revenue streams integrated

40+ drill-downs built across views

100% reduction in manual reports

12 revenue streams integrated

40+ drill-downs built across views

100% reduction in manual reports